Continuation Chart Patterns
All chart patterns reviewed until now were reversal patterns. But, there are also patterns that signal the continuation of the prevailing trend. These patterns are important to understand since they generate trades in direction of the prevailing trend thus generating low risk trading opportunities.
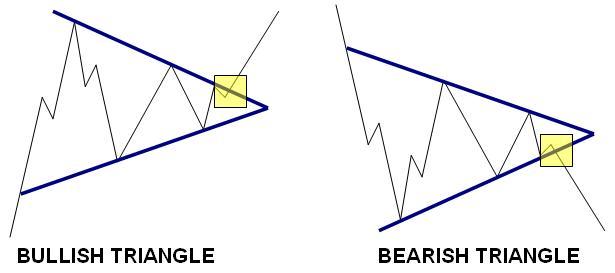
Symmetrical Triangles
These types of patters are formed by two converging trendlines:
[Image 6]
Symmetrical triangles indicate consensus, new highs or lows are reached, the price makes a series of lower highs and higher lows, these points connected make two converging trendlines. As the price approaches the apex, supply and demand reaches a temporary equilibrium. The pattern is completed when either the support or resistance trendline is broken.
Bullish Symmetrical Triangle in Action
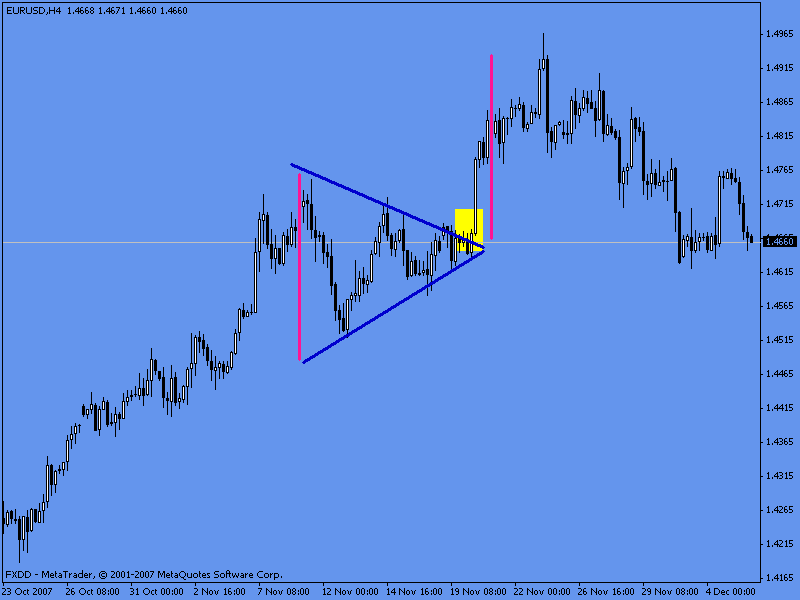
[Chart 3]
In this 4H EURUSD chart a symmetrical triangle is formed during an uptrend. The market eventually breaks the resistance-trendline and the target price is reached. (Please see below rules for placing target for all triangles).
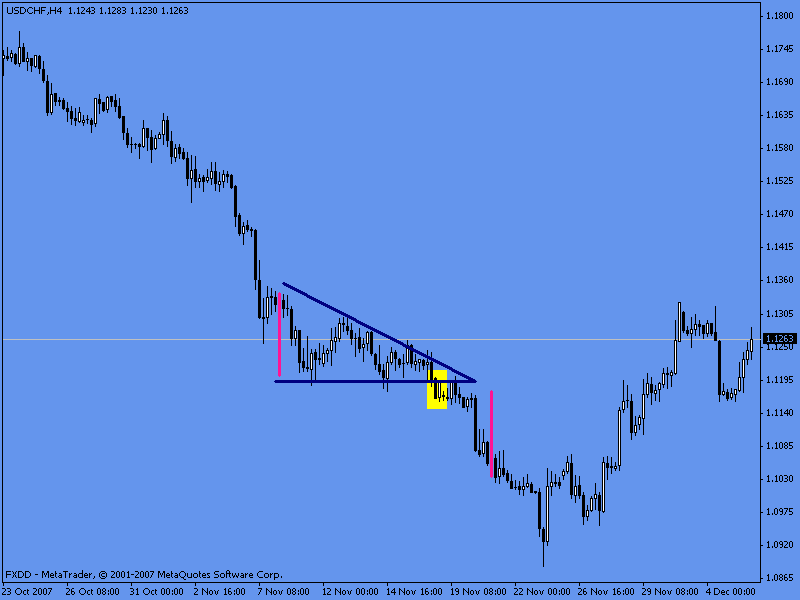
Bearish Symmetrical Triangle in Action

[Chart 4]
This bearish triangle in the EURUSD 5 min chart is completed when the market breaks the support-trendline.
Commonly target used for symmetrical triangles
Measure the height of the triangle in terms of pips and add/subtract the same amount of pips from the eventual breakout level.
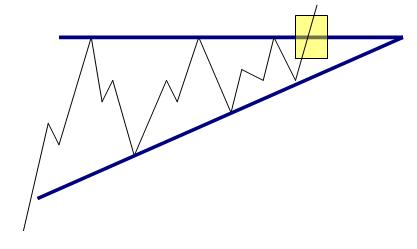
Ascending Triangles
Ascending triangles are formed in an uptrend, after the prices rallied to new highs:
[Image 5]
At this point the bears come in play attracted by the higher prices and start selling at such highs making the price pull back to a support level where the bulls take control again of the market making the prices rally to test previous highs. A second decline is followed to the support-trendline (higher lows). At this point, the bears realize there is not enough supply to take the prices lower, as they close out their short positions; bulls take again the command of prices making them rally to new highs. The pattern is completed when the trendline-resistance line is broken.
Ascending Triangle in Action
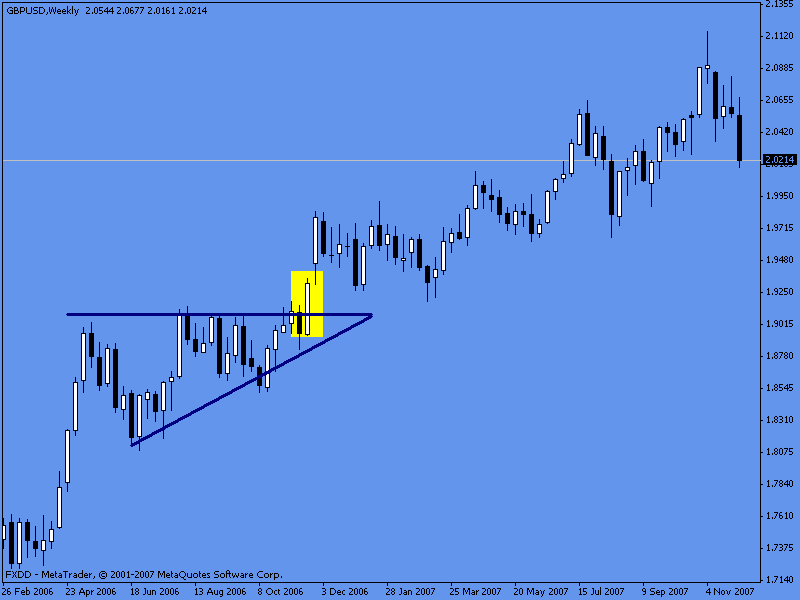
[Chart 4]
Commonly used target for ascending triangles
Measure the height of the triangle in terms of pips and add/subtract the same amount of pips from the eventual breakout level.
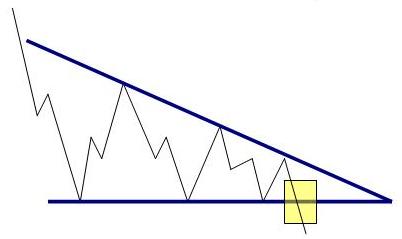
Descending Triangles
Descending triangles are formed in a downtrend after new lows have been reached:
[Image 6]
At this point the bulls come in play attracted by the lower prices and start buying at such lows making the price rally to the resistance level where the bears take control again of the market making the prices reach lower levels to test previous lows. A second rally is followed to the resistance-trendline (lower highs). At this point, bulls realize there is not enough demand to take the prices higher, as they close out their long positions; bears take again the command of the market making it rally to new lows. The pattern is completed when the trendline-support line is broken.
Descending Triangle in Action
[Chart 5]
Triangles are among the most reliable chart patterns of technical analysis, as changes in supply and demand are very well defined.
Commonly used target for descending triangles
Measure the height of the triangle in terms of pips and add/subtract the same amount of pips from the eventual breakout level.
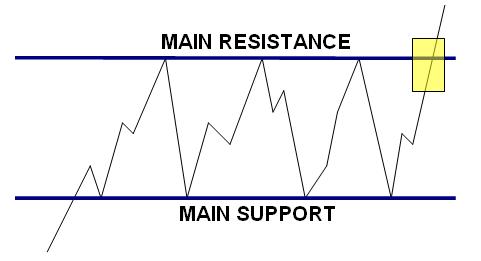
Bullish Rectangles
Bullish rectangles are periods of consolidation that appear after a sharp move:
[Image 2]
These types of rectangles or channels are periods of consolidation (after a sharp rally) where supply and demand meet. At this period of indecision, investors and traders try to digest the recent sharp move. In a bullish rectangle, bulls prefer to take partial profits, and wait for further pull backs so they can make their move again. This pattern is completed when the resistance is broken.
Bullish Rectangles in Action
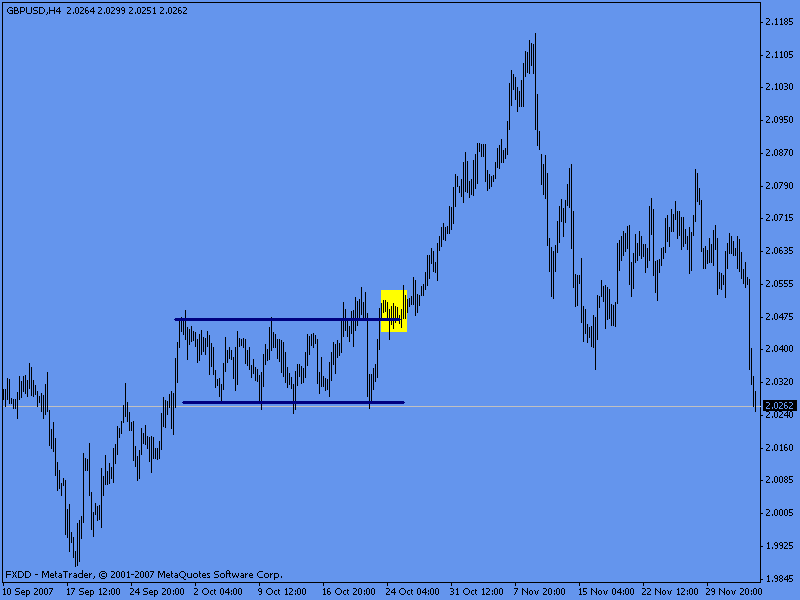
[Image 9]
Bearish Rectangles
Bearish rectangles are periods of consolidation that appear after a sharp decline:
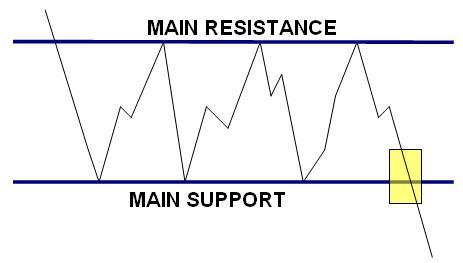
[Image 10]
In a bearish rectangle, bears close most of their short positions and wait for further rallies so they can sell again at higher prices. Although the sentiment is still strong in favor of the prevailing trend, traders and investors prefer to take a rest. The support must be broken in order for the pattern to be complete.
Bearish rectangle in Action
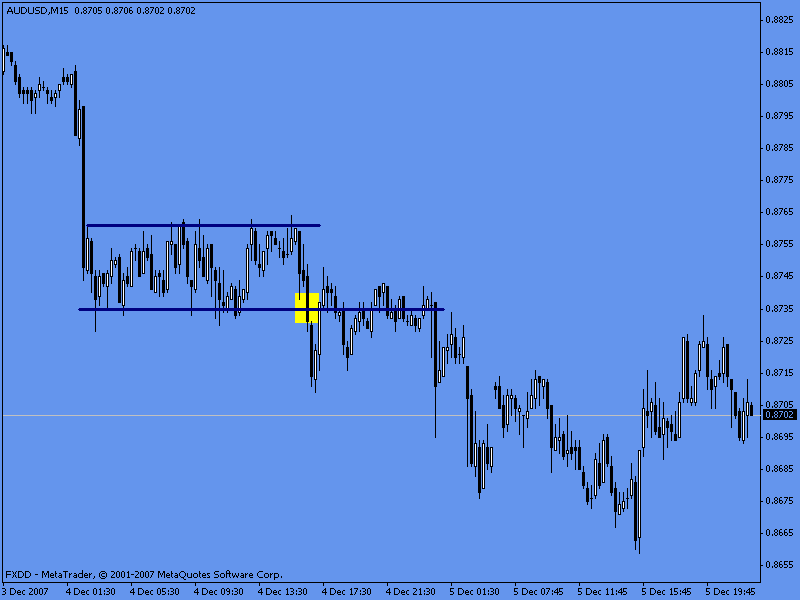
[Chart 6]
Bears take a little rest after the sharp decline. When the market breaks the support zone the pattern is completed.
Remember again, once the price breaks an important support/resistance zone, it becomes an important resistance/support zone. As in the chart above, the resistance became an important support line where the price bounced off to reach new highs.
Rectangles commonly used target levels
Measure the height of the triangle and add/subtract it to the point of the eventual break out.