Reversal Chart Patterns
Double Top
The double top is made up by two extreme peaks like the illustration below:

[Image 3]
After the first peak, there must be a decline of no more than 25% of the uptrend. (This decline makes up a support that must be broken for the pattern to be complete). Then the price rallies again to the resistance made by the first peak. Highs should be roughly equal. Then the price falls back down from resistance to support, and finally breaks the support (yellow box).
This type of patterns can be used during trending markets signaling a possible reversal or during trendless markets, to signal a possible change in the direction of the market.
Double Top in Action
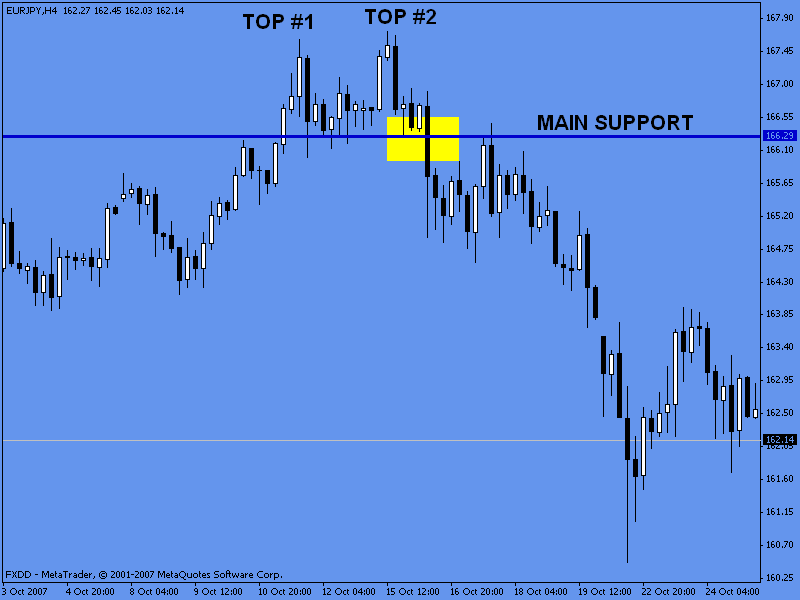
[Chart 1]
See top #1 and top #2 have similar highs. The pattern is not valid until the market breaks the main support which happens in the yellow box. Notice also how the support zone becomes a resistance and stopped the market from reaching higher levels.
Double top commonly used target
Measure the amount of pips from the first peak to the support line (where it bounced back up to the second peak). Subtract the same amount of pips from the support line. This last quote will give us the target price.
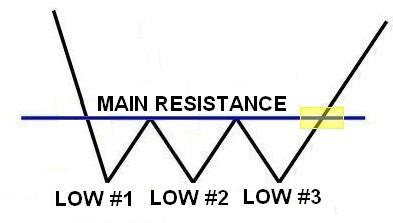
Double Bottom
The double bottom pattern is made up by two extreme lows like the illustration below:
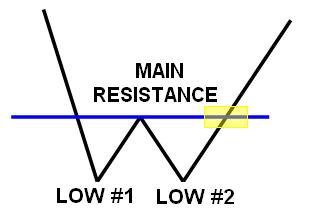
[Image 3]
After the first low, there must be a rally of no more than 25% of the downtrend. (This rally makes up the main resistance that must be broken for the pattern to be complete). Then the price drops again to the resistance made by the first low. Lows should be roughly equal. Then the price rallies again from the second low to the main resistance, and finally breaks the main resistance zone (yellow box).
This type of pattern can be used during trending markets signaling a possible reversal or during trendless markets, to signal a possible change in the direction of the market.
Double Bottom in Action
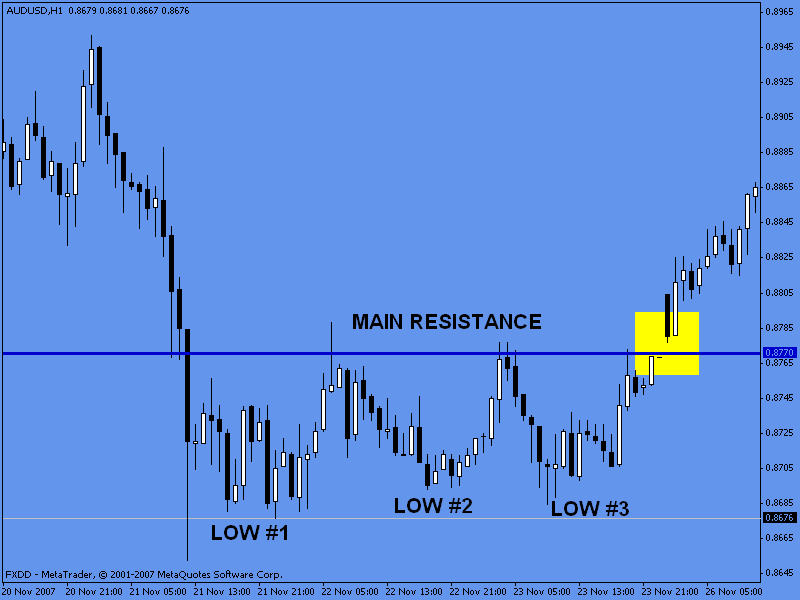
[Chart 2]
Lows #1 and #2 have similar levels. The pattern not considered valid until the market breaks the main resistance zone. Notice how the resistance zone becomes a support zone preventing prices from falling below those levels.
Double bottom commonly used target
Measure the amount of pips from the first low to the resistance line. Add the same amount to the resistance line; this last quote will give us the target price.
Both patterns reflect changes in supply and demand. In a double top, it reflects the inability of buyers to take the prices to new highs and trade above them. In a double bottom, the inability of sellers to break the lows and pull the prices further down.
Remember: The resistance/support made after the first peak/sell off could act as a support/resistance after the price breaks the zone.
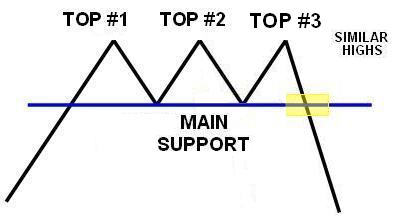
Triple Top
The triple top is similar to double tops, but has three peaks (instead of two):
[Image 6]
Same mechanics are followed here. A prior trend has to be reversed, three peaks reasonably equivalent to each other, and an important support to be broken in order to complete the pattern. In this pattern the changes in supply and demand take a little longer to change the perspective of traders about the markets.
Triple top in Action
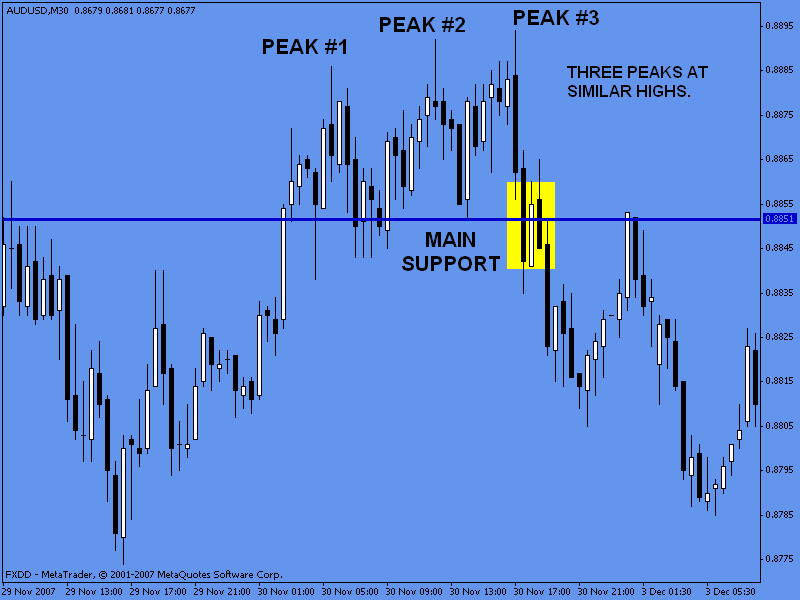
[Chart 3]
Three peaks form the triple top, the pattern becomes valid when the market breaks the main support area. Notice how the market retraces back to the resistance zone (previously a support zone) to test it.
The mechanics to get the target price for these patterns are the same as the double top and bottom.
Triple Bottom
The triple bottom is similar to double bottoms, but has three troughs (instead of two):
[Image 8]
Same mechanics are followed here, a prior trend has to be reversed, three troughs reasonably equivalent to each other, and an important resistance to be broken in order for the pattern to be complete. In this pattern the balance in supply and demand take a little longer to change the perspective of traders and investors about the markets.
Triple Bottom in Action
[Chart 4]
This triple bottom becomes valid when the market breaks through the main resistance area (yellow box).
The mechanics to get the target price for these patterns are the same as the double top and bottoms.
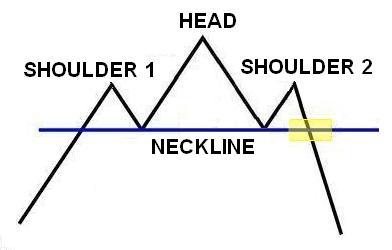
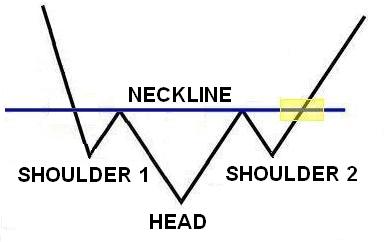
Head & Shoulders Top
The pattern is formed by three successive peaks:
[Image 4]
The second peak or the “head” must be the highest peak. The two other peaks or “shoulders” should be roughly equal. A support is made by the first and second bounces from the first and second peaks; this is commonly named as a neckline. The pattern is completed after the neckline is broken through and the price trades below it. The neckline becomes an important resistance once it has been broken.
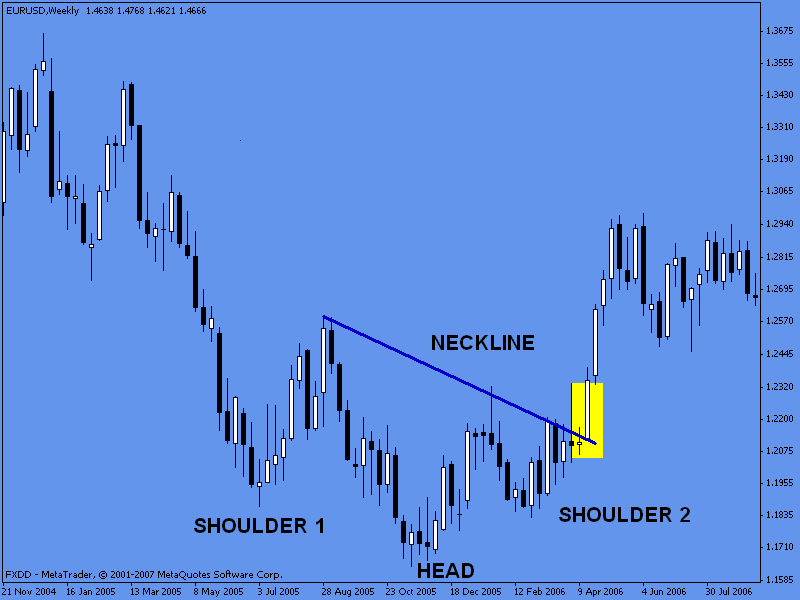
Head and Shoulders in Action
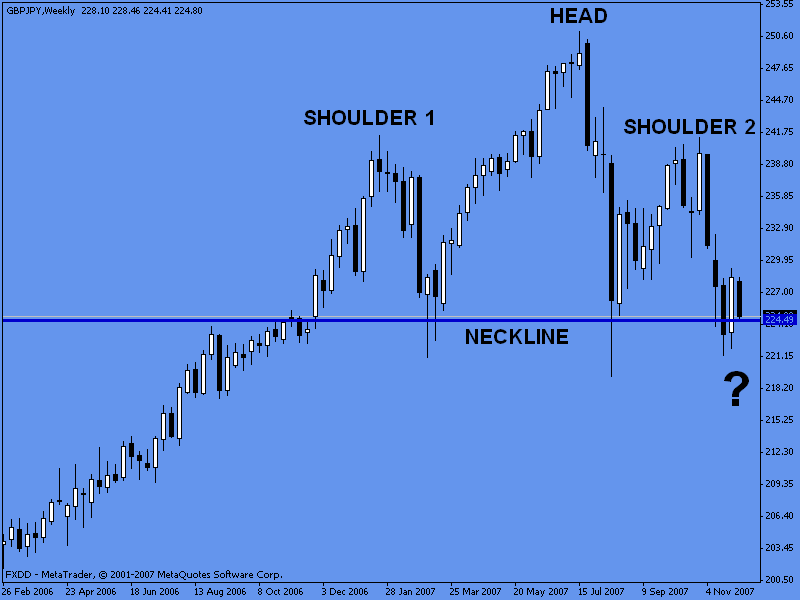
[Chart 5]
This is a head & shoulders pattern under development, the market has not been able to break the neckline, thus it isn’t a valid head and shoulders pattern yet. Why did we use this one? Because it is important to track them when they are forming (not after the fact, when we know what happened) and see how they look like. This is the GBPJPY weekly chart, so if this pattern proves to be valid, it has a potential of more than 2,000 pips.
Head and shoulders top commonly used target
Measure the amount of pips from the highest peak (head) to the neckline. Subtract the same amount from the neckline; this final price will give you the target price.
Head & Shoulders Bottom
This pattern is made off three consecutive lows.
[Image 4]
The second low is the deepest low (head), while the other two lows are roughly equal (shoulders). The pattern is considered complete when the neckline is broken.
Head and Shoulders in Action
[Chart 6]
Notice here the neckline is similar to a trendline (instead of a resistance).
Head and shoulders bottom commonly used target
Measure the amount of pips from the lowest low reached (head) to the neckline, and add this amount to the neckline to get the target price.