Moving Averages (MA)
MA’s measure the average price of the previous n-periods. For instance, a MA(5) measures the average price of the last 5 bars. However, as the name implies, the average changes as when a new period is added the last period is dropped. So it is always the MA of the last 5 periods.
As in any other indicator, the period selected is a critical element. The shorter the period the more sensitive the MA is to price movements and is less consistent, and the larger the period chosen, the more consistent it is, but at the same time less sensitive to price fluctuations.
The moving average explained above is called simple moving average (SMA). However, there are also other popular types of moving averages: exponential moving average (EMA) and weighted moving average (WMA). The only difference between the SMA and the other two approaches is the weight assigned to each period. EMA´s and WMA´s assign more weight to the periods that are closer to the current price, while in SMA all periods are equally weighted.
[Chart 1]
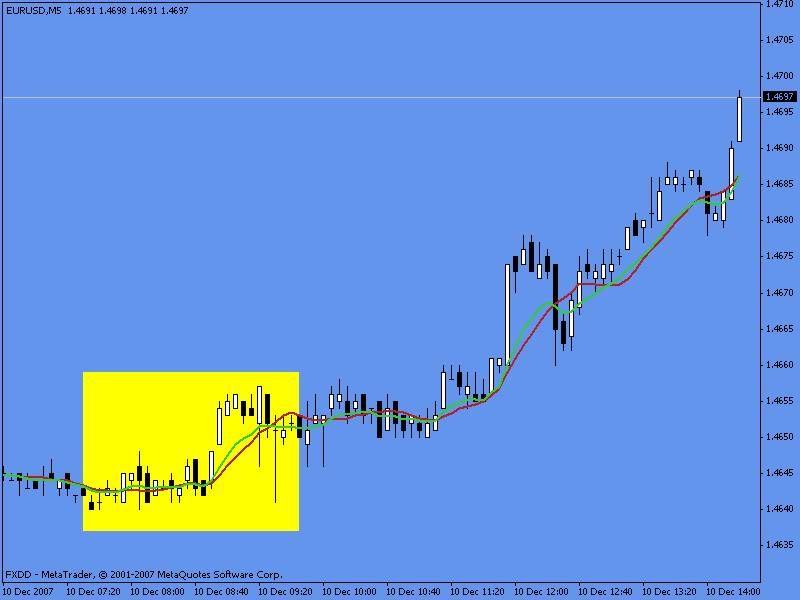
Let’s concentrate on the yellow box. The green line is a 10 period exponential moving average (EMA) while the red one is a 10 period simple moving average (SMA). At the beginning of the yellow box there is a small period of consolidation where moving averages are pretty close to each other, there is nothing to be noticed. But once the market starts moving, you will see the EMA(10) lifts up first, then the SMA(10). This is because the EMA gives more weight to periods closer to the market action than SMA’s. This means that EMA’s will always be closer to the current market action than SMA.
Which one to use?
We prefer to use EMA since they give more value to more recent price fluctuations, and reflect what is happening at any given time with more accuracy. However, there are traders that prefer to use SMA.
Usage of Moving Averages
Usage No. 1 – As stated before, MA´s are trend following indicators.
They smooth out price fluctuations and make it easier to identify a trend. There are several ways in which this indicator can be used to identify the trend:
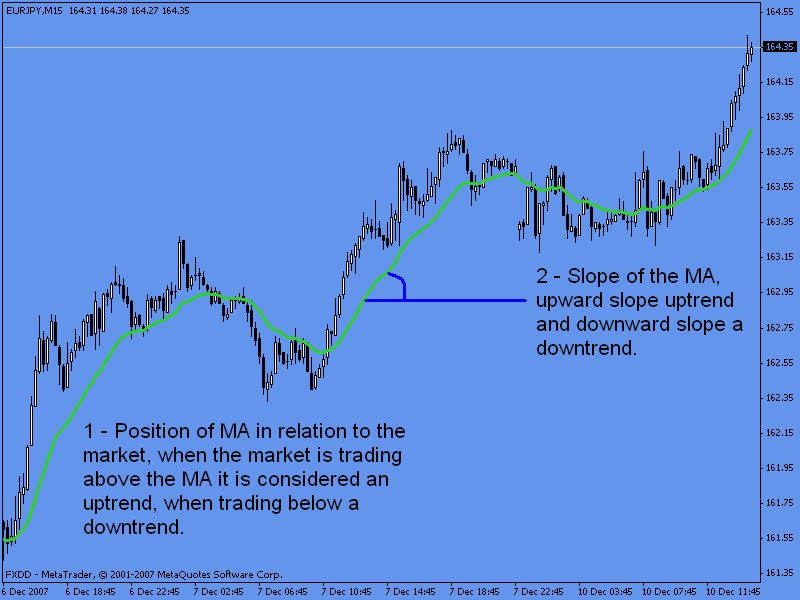
1 – Location of the MA in relation to price action. If the MA is above the price, it indicates a downtrend is in place. If the moving average is below the price then it is considered an uptrend.
2 – With the slope of the MA. When the MA is sloping up, the market is considered to be in an uptrend. When it is sloping down the market is considered to be in a downtrend. When there is no slope (close to a flat line), then the market is trendless or sideways
[Chart 2]
The chart above shows both ways to identify a trend. When the price breaks the EMA(21), a significant change in trend could be imminent (or at least a retracement or consolidation period). Also the slope of the EMA(21) keeps good track of the trend. There are also periods of indecision (when the market breaks the MA back and forth). During these periods, the EMA(21) could lead us to take false conclusions about the market condition [when the EMA(21) is almost flat.]
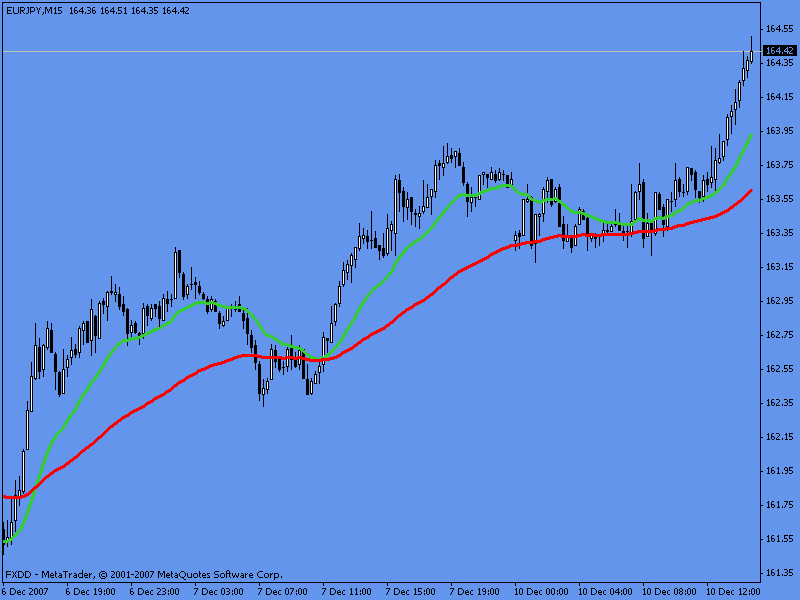
For this reason it is always advised to use a second MA. This allows us to keep track of the location of one MA relative to the other. When the short period MA is above the longer period MA the trend is considered an uptrend, and when the short period moving average is below the larger period MA, the trend is considered to be a downtrend.
[Chart 3]
In this case we added an EMA(75) [red line]. When the EMA(21) [green line] is above the EMA(75) [red line] the trend is considered an uptrend (which is the case for the chart above). On the other hand, when the EMA(21) is below the EMA(75) then the trend is considered to be a downtrend.
Usage No. 2 – MA as support and resistance.
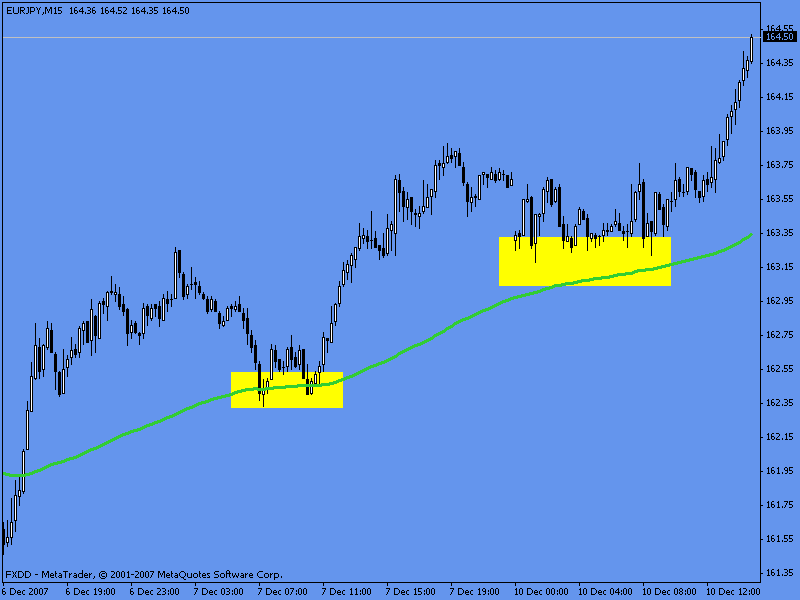
Some MA’s are used to establish levels of support and resistance. The most common periods used in MA for this kind of usage are: 50, 100, 200, 144, 89, and 34.
[Chart 4]
In this chart we used an EMA(144) [notice it is the same chart we used for the other MA’s examples]. As you can see this moving average is a very powerful price level in the chart. Almost all the time, something happens when the price action approaches to this EMA, either it bounces off from it or makes a wild break out. This EMA(144) is significant on all charts and all time frames, we personally use it a lot as a very important level of support and resistance.
Usage No. 3 – Moving averages as cross-over signals.
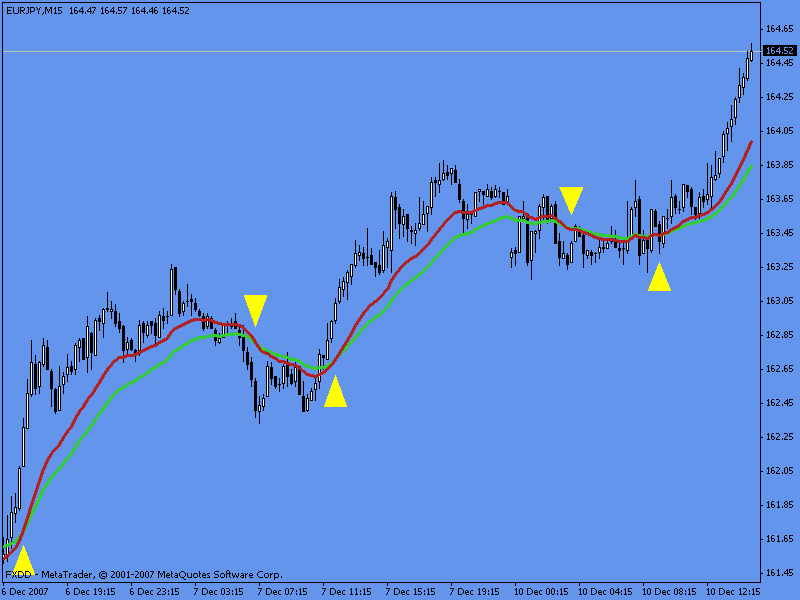
Perhaps the most common and easy trading system is this one. It consists in plotting a short period moving average and a larger period moving average. When the short period moving average crosses above the large period moving average, it signals a buy signal. When the short period MA crosses down the larger period moving average, it indicates a sell signal.
[Chart 5]
In the chart above we used an EMA(21) as the short period MA (red line) and an EMA(34) as the longer period MA (green line). There are a total of 5 cross-over signals: 3 buy and 2 sell signals. The three buy signals are generated when the short period MA crosses above the long period MA while the 2 short signals are generated when the short period MA crosses below the long period MA.
Combination of Moving Averages Signals
During trending conditions these types of systems work very well, getting you in the market early and letting you catch most of the move. But during consolidation periods, a moving average crossover gives many false signals.
For this reason is important to determine ahead of time the trend on each trading possibility. If there is an existing trend, then we use a system that works during trending conditions, if there is no trend, then we use a system that works under ranging conditions.
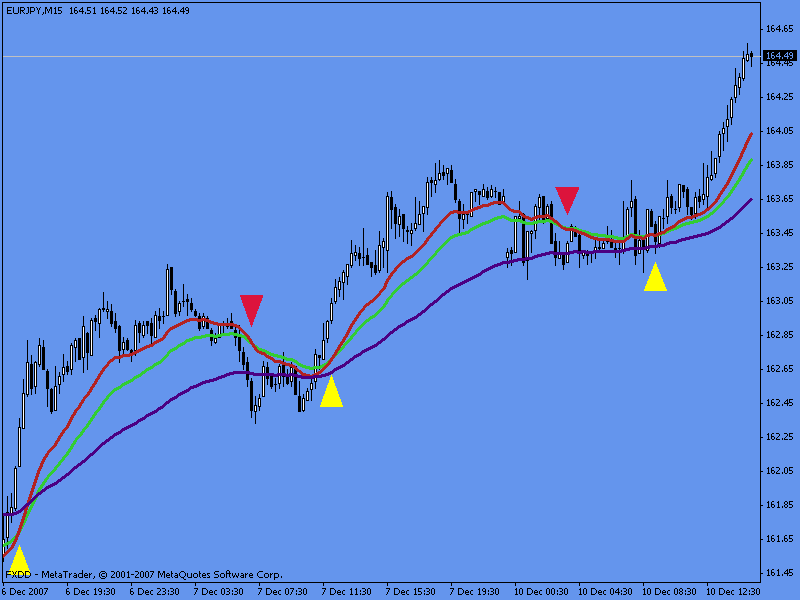
Let’s try to filter signals on the crossover above with a longer period moving average that will be of use to us as trend identification.
[Chart 6]
What we are trying to accomplish with this new large period MA is to filter out signals against the trend. We are using the new EMA(75) as a trend identification – position of the market in relation to the MA. According to this new rule, most of the time the market stays above the EMA(75) indicating an uptrend. What we are going to do now is to validate all long signals and ignore all short signals as they are against the direction of the trend and we know this system works best during trending conditions taking trades in direction of the trend. So we filter out all short signals and go ahead only with long signals. This produces better results than taking every single signal.
Remember also that the signals given by a MA crossover are very sensitive to the number of periods chosen for the MA´s. If short periods of MA´s are chosen, then the system is going to get you in the market early but also will give you many false signals. On the other hand, if larger periods are chosen, the system will get you in the market later, (giving up some profits) but will give you more accurate signals.