Trends and Range bound Conditions
Trend
One of the basic principles of technical analysis, as we have already discussed, is that the price (or market) trends. But what exactly does that mean? Or more importantly, when is the market trending?
It is said that the market is trending when price action reaches –
UPTREND – successive higher highs and higher lows on its way up
DOWNTREND – lower lows and lower highs on its way down.
Here is a chart trending up
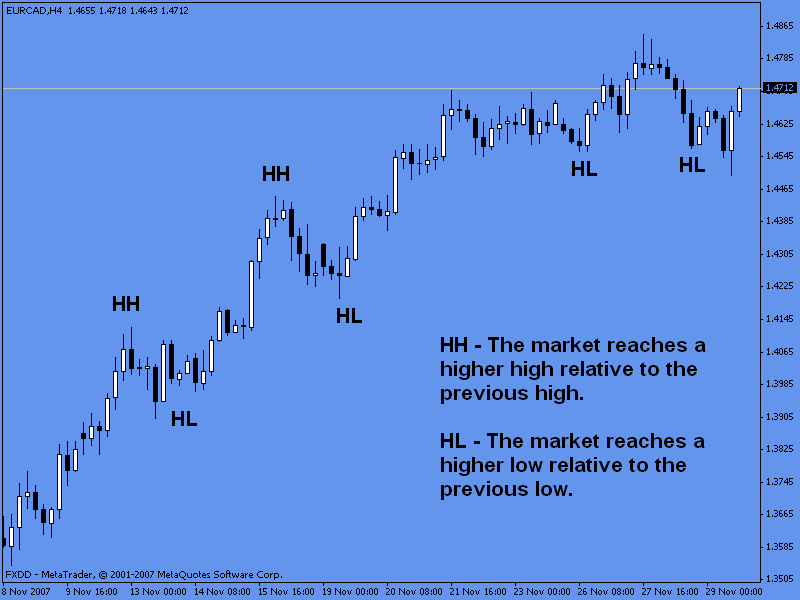
[Chart 9]
And here is a chart trending down
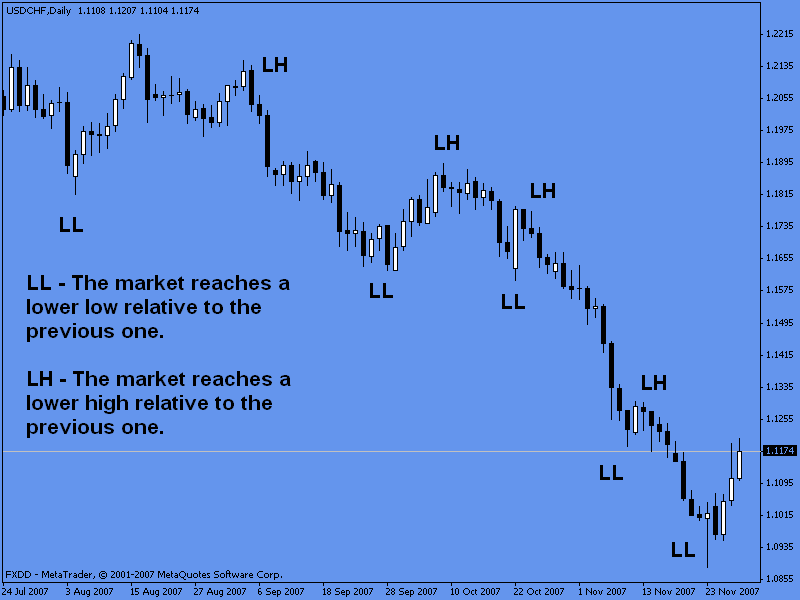
[Chart 10]
Chart 1 and 2 are clear examples of trending markets.
Another important question traders should answer is, when is the market not considered to be trending?
That leads us to the next concept…
Range Bound and Ranging Markets
The market is not trending when it is not following a clear direction (up or down). This is condition is also called as sideways or trendless markets.
Now, the market could be ranging in two different ways: when there are well defined extreme levels (support and resistance zones are well established) or when the market has no defined extreme levels.
Here is a sideway market with no well defined extremes.
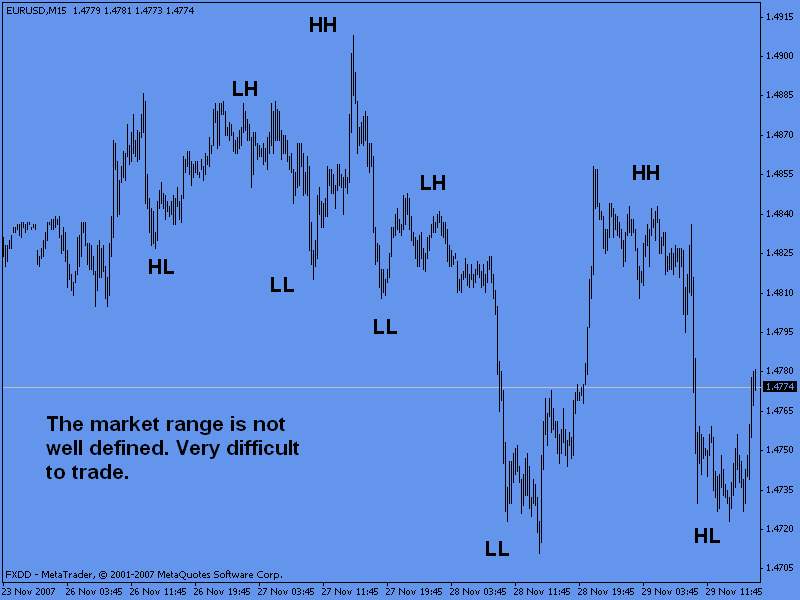
[Chart 11]
As you can see, the market is not following any direction. It keeps ranging back and forth, making higher highs but also lower lows with no consistent pattern. When the market is ranging like this it is very difficult to trade.
Here is a ranging market with well defined extremes:
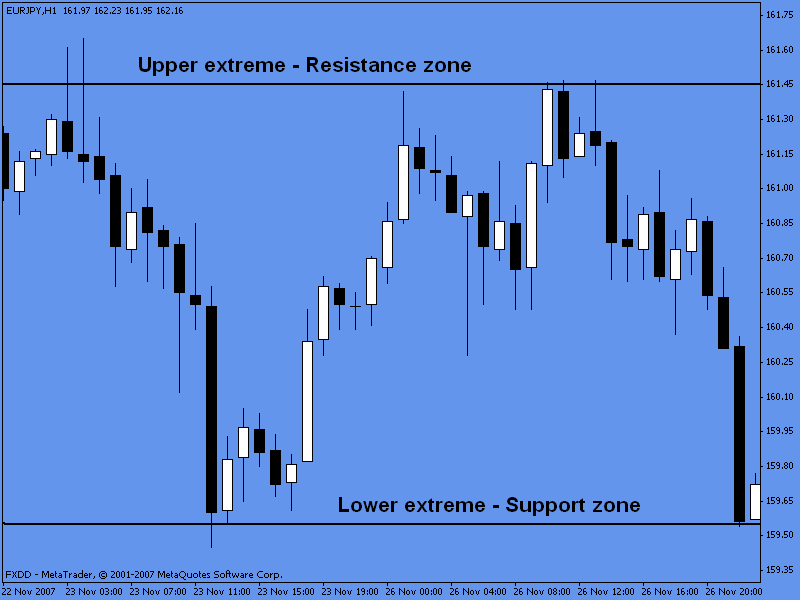
[Chart 12]
When the market is ranging this way, trading it is relatively easier, traders tend to buy around the support zone and sell around the resistance zone.
Trendlines
Trendlines are very important tools for trend identification, confirmation and to measure the intensity of the trend.
Trendlines are lines connecting two or more important points when price has bottomed or topped and then it is extended to the future where it is expected to act again as a support or resistance zone. So we can say trendlines are support and resistance lines with either and upward (uptrends) or downward (downtrends) slope.
Let’s take a look at some charts.
Uptrend trendline
Two or more higher lows connected (upward slope), identifying an uptrend.
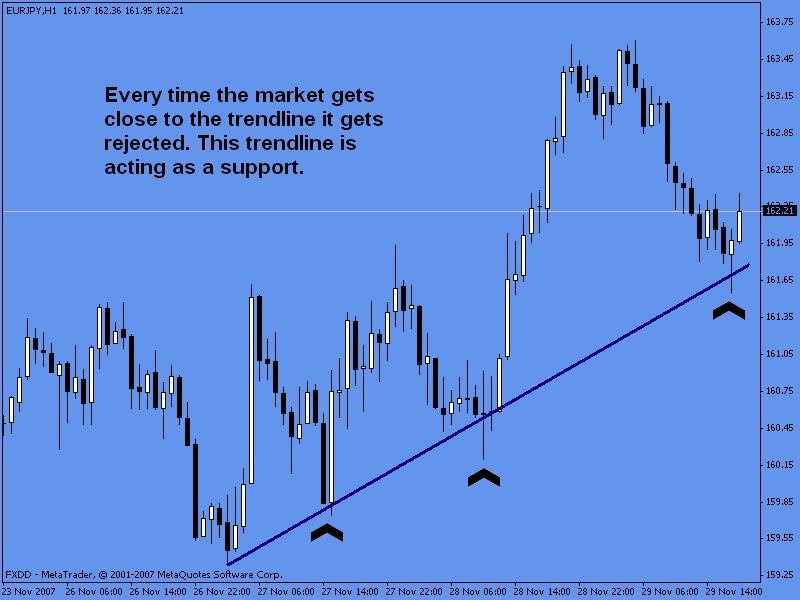
[Chart 13]
There are four points (higher lows) connecting this up-trendline. As long as the market keeps trading above the trendline the uptrend is intact. If a sustained break below the trendline happened, a reversal, a correction or a consolidation period (range) is plausible.
Downtrend trendline
Two or more lower highs connected (downward slope).
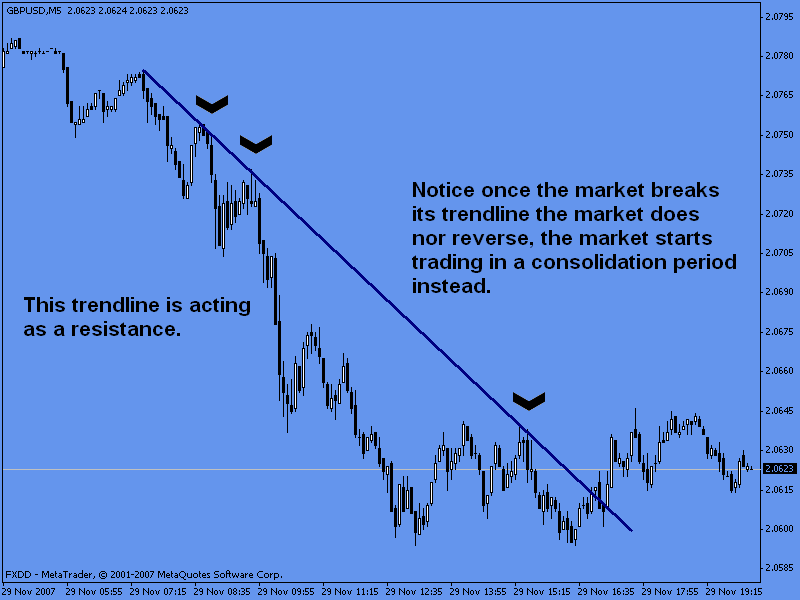
[Chart 14]
Here we have a downtrend trendline; it suggests that the demand for the given instrument is decreasing even when the prices are falling. Four points (lower highs) connect the trendline indicating a downtrend. As long as the price stays below the trendline, the trend stays intact. But as we see, the trendline is violated indicating that the market will reverse, consolidate or have a correction.
Two more points:
The intensity of the trend is measured by the slope of the trendline. The steeper the trendline the stronger the trend is and the more likely prices are to react at extreme levels.
The significance of trendlines depends on how many times price has bounced off from it: the more times the price has bounced from the trendline, the more significance the trendline has and the more likely it is to hold the price from breaking it.
At the beginning of this section we mentioned trendlines are like support and resistance zones, and it’s true because the same rules apply for both of them:
A sustained break above/below the trendline need to happen before the trendline gets violated.
When the market approaches to the trendline, we should think the market will get rejected from it.
Once a trendline gets violated, it could become a resistance if it was a support and vice versa.
Some times it can be difficult to find a trendline even when the markets are trending
Trendlines should be part of the analysis and not the tool to make the final decision to get in or out the market. It will produce better results when used in combination with other technical tools.