Fixed Fractional Trading
This particular MM technique states that a trader should risk a fixed percentage of the trading account on each trade.
The greatest advantage about this technique is that you are able to change the parameters according to your risk profile. We at StraightForex see value in all the MM techniques but favor this approach due to it’s ability to be customized and its inherent versatility.
Although slightly more complicated to use all you need is an Excel spreadsheet with the exchange rates, account size and % risk input and it will provide the correct position size. We have a comprehensive spreadsheet with all the major currency pairs already built that is available for free.
For instance, a conservative trader could use 1% or even .5% of risk per trade. While traders with a higher risk profile could take that percentage up to 5%. The parameters could also be changed based on how many and what currency pairs you trade.
For example, maybe you only trade two currency pairs, the pound and the euro. You also know that the pound is more volatile than the euro, so you are willing to risk less on pound trades than on euro trades. You also want to keep your overall risk below 2% of your trading account. In this case you will set the following parameters:
EUR/USD risk per trade = 1.25%
GBP/USD risk per trade = .75%
This way you can keep your overall risk below 2%, but also the parameters are weighted so you increase your chances of profitability.
Getting back to our traders trading account, let us take a look at the results obtained from the same losing and winning streaks we used in the past section.
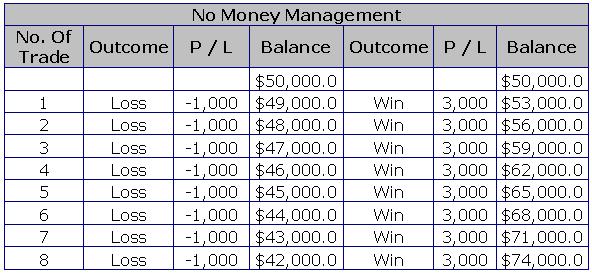
[Table 1]
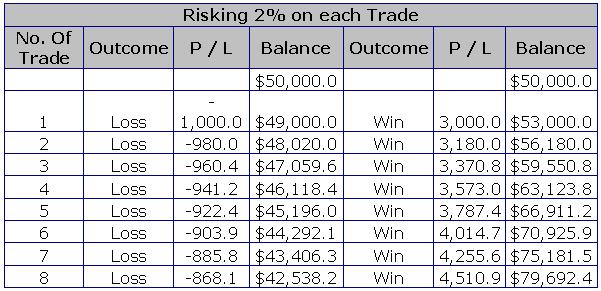
[Table 2]
On the losing side there is not much difference, when not using MM at all the loss would be $8,000 vs. $7,462 when we used MM. Remember though this is only an 8 trade sample.
What is interesting about this technique is the boost it has in profits. When no MM was used at all, the account ended up at $74,000. On the other hand, when MM was used the account ended up at $79,692. This is a difference of $5,692 just over 8 trades. Imagine what it can do for you after 100 trades.
However, as we discussed before, actual trading isn’t like that scenario. For the same drawdown sequence we analyzed before, the results are the following:
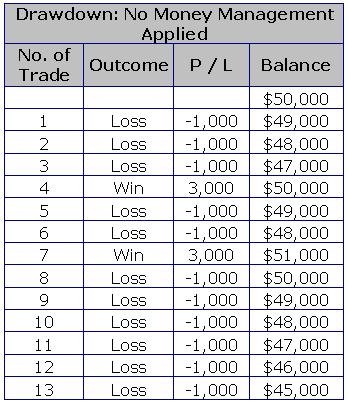
[Table 3]
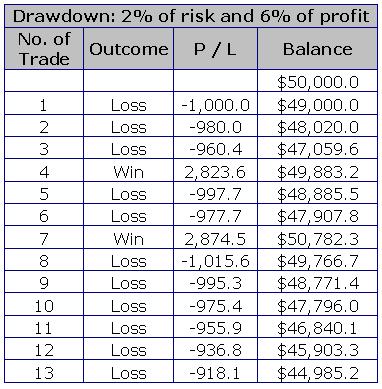
[Table 4]
The difference between these two approaches is just $14.80. Take note though that as the sample increases the number of events, the results for this MM technique would be far better than using no MM at all. Take for instance the following sequence (same sequence repeated three times).
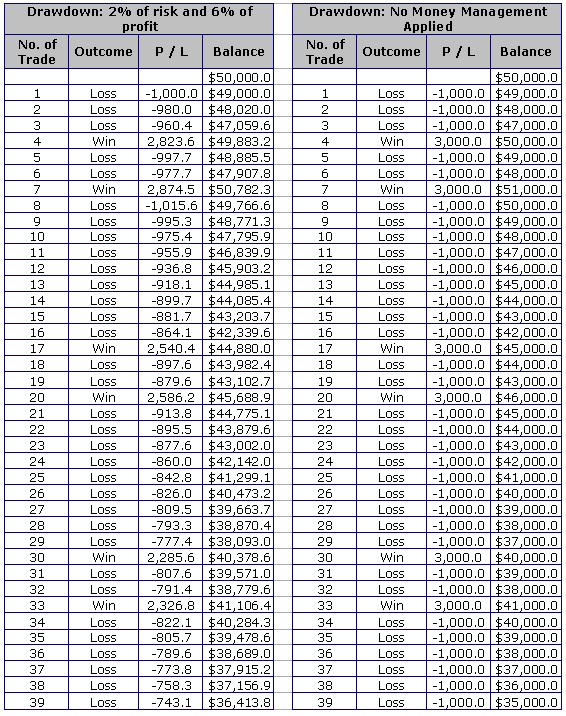
[Table 5]
When no MM technique is applied, the balance ends up at $35,000, while when using MM the balance ends up at $36,414.
Now, for the consecutive winning streak:
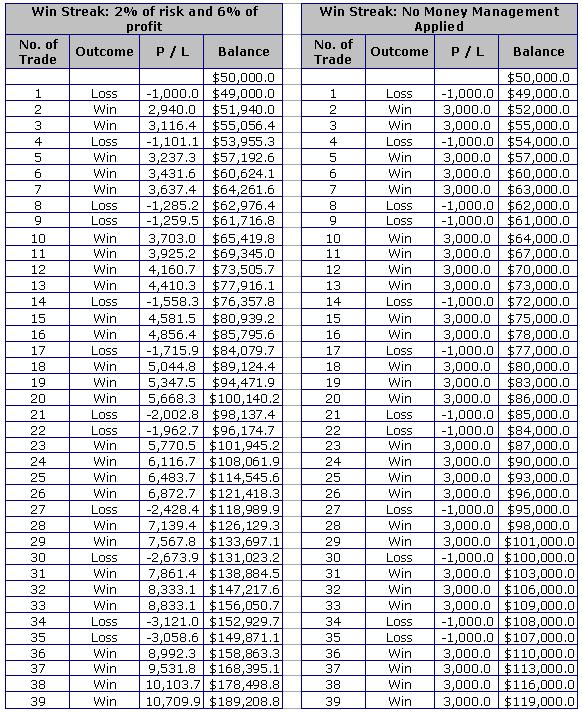
[Table 6]
Using the same sample number of trades as the example above, the results are very interesting.
When no MM is applied, there is $69,000 in profits; on the other hand, using the fixed fractional technique the profits go up to $139,208 with the same sequence of trades!!! A difference of $70,208, this is what MM can really do for every trader.