High Probability Trades
Until now we have studied that it isn’t wise to base our trading signals relying solely on technical indicators. In order to increase the odds of each signal we must combine technical indicators with price behavior so we get more accurate signals.
In this section, we will see how to effectively combine signals generated by price behavior with signals generated by technical indicators. Using these two tools in conjunction, the outcome of our trades will increase significantly in our favor.
We will suggest the usage of technical indicators that produce the best signals when combined with price behavior reversal patterns.
Moving averages
Trend detection
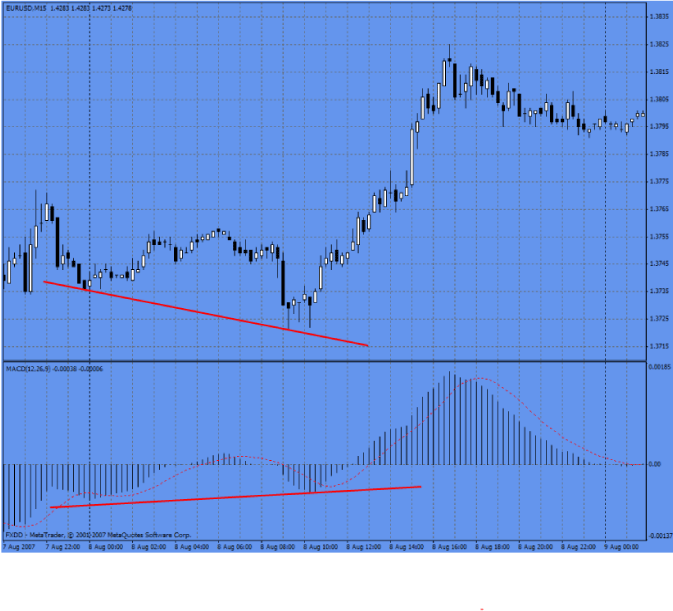
When a trend is detected by the EMA(50), we only take trades in direction of the trend.
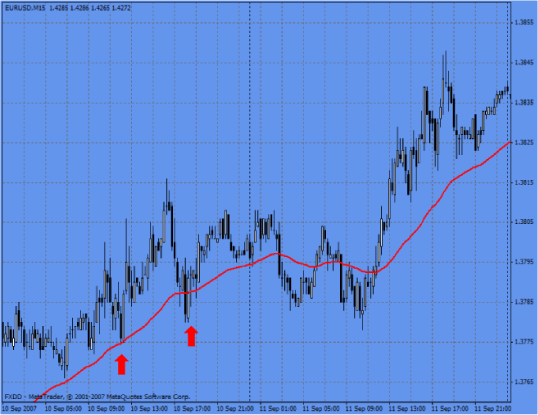
[Chart 1]
On the first arrow, a bullish engulfing pattern sets in above the EMA 50, while the moving average was indicating an uptrend. This allows us to position ourselves in a good long trade. The second arrow indicate a piercing pattern (although the long wicks make this one somewhat debateable), this pattern closes just above the EMA(50), this gives us the opportunity to get long and catch another move. This also illustrates a support zone being formed by that pattern as it get tested and hold a bit later.
If we had wisely placed our stop loss below the base of the pattern we would have been part of the large move later
MA as support and resistance
Using the same chart above, we could see that the EMA acts several times as a support and resistance level. On four of the five arrows the price bounced off the EMA and made an indication that at those levels traders and investors’ sentiment was changing. On a number of times it left behind a candlestick pattern that could have triggered our signal including one episode when price briefly closed below the EMA before forming a piercing pattern closing above.
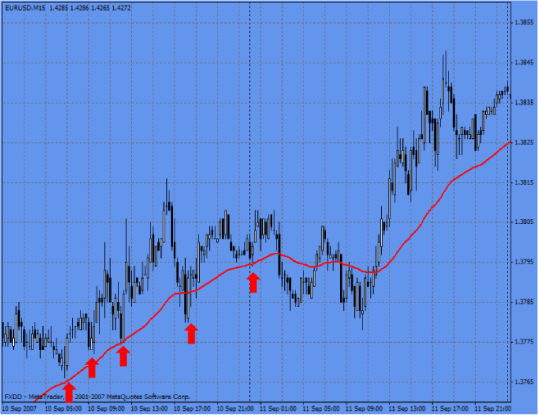
[Chart 2]
MA Crossover system
The mechanics of a trade here would be: once a crossover has happened, we will look for a candlestick pattern in direction of the trend for a trade confirmation.
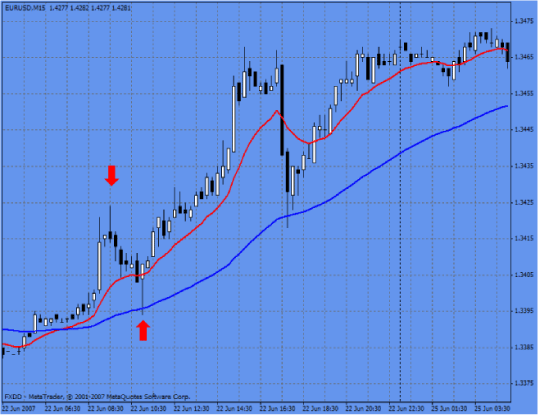
[Chart 3]
The first signal off a shooting star is invalid as the faster EMA is above the slow EMA meaning only long trades are allowed. The second is a great signal and went on to be highly profitable. In this case the 13 EMA was above the 62 so we were looking for a long signal
MACD
Overbought/Oversold Condition
Wait for the indicator to reach an overbought/oversold condition level, and then look for a reversal candlestick pattern in direction of the trend on the second peak/trough.
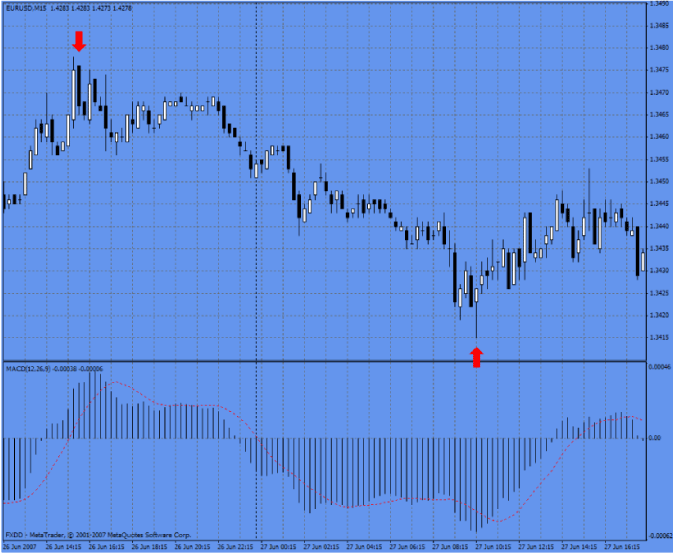
[Chart 4]
The first signal occurs when a piercing pattern is formed at the top of the range and the MACD reading is overbought. The second signal occurs when the MACD reading is oversold and a hammer is formed at the bottom of the range.
Divergence
Look for a divergence setting up, and then seek a candlestick reversal pattern at the last peak/trough of the divergence pattern, if it happens, it will trigger our signal.
[Chart 5]
A hammer is formed at the second peak of the divergence pattern.
Divergence signals are very powerful when combined with price behavior, since both of them show the trend is not as strong as it used to be.
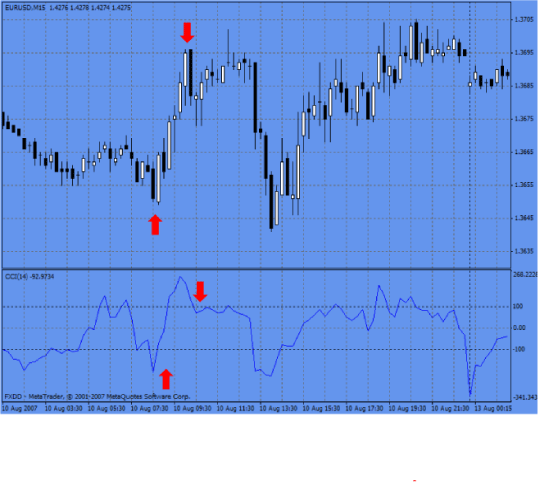
CCI
Overbought/Oversold Condition
Look for a reversal price pattern while the CCI reading is at extreme levels and then goes back to neutral levels.
In this chart we see the CCI returning from an oversold level in conjunction with a bullish engulfing followed by an overbought reading and a bearish engulfing
So if a reversal pattern forms at the same time as level return towards neutral it is time to open a position
[Chart 6]
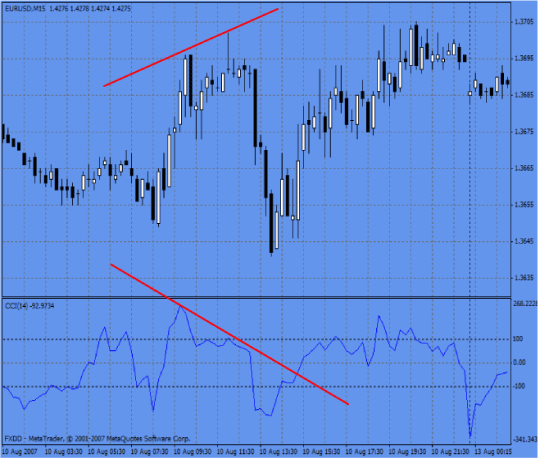
Divergence
Look for a divergence pattern and seek the candlestick reversal pattern on the last peak/trough.
This is the same chart as the last one and we have used it as it illustrates a beautiful divergence with the tombstone doji creating a new high as the CCI drops.
This meets our goal of a reversal pattern while a divergence is evident and we would have opened a short position and been part of a good move. Two thumbs up for that one!
[Chart 7]
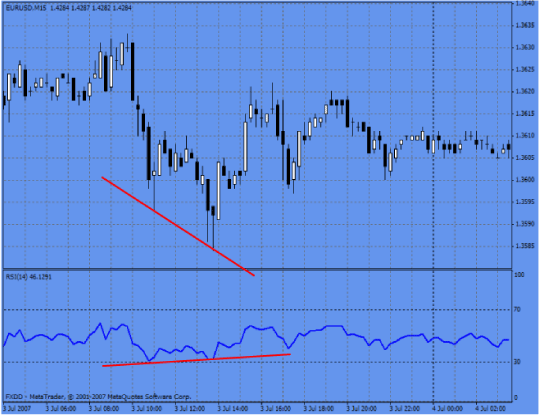
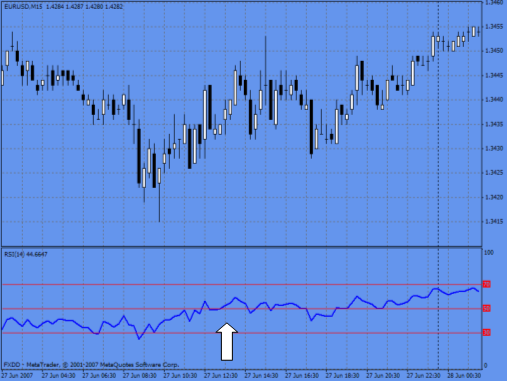
RSI
Overbought/Oversold Condition
Look for overbought/oversold conditions, then look for a candlestick reversal pattern.
This follows the same principle of overbought/oversold. Wait until indicator comes back from an extreme and if it coincides with a reversal pattern…..what are you waiting for? Open a position ?.

[Chart 8]
Divergence
Use the same mechanics applied to prior indicators.
[Chart 9]
The signal occurs when a hammer pattern is formed at the second trough of a divergence pattern. As I mentioned before, the combination of divergence trades with candlestick behavior are very powerful because both indicate the trend is not as strong as it used to be.
Trend indicator
Take only long signals when the reading is above 50 and a reversal pattern is present. Short signals are only taken when the reading is below 50 and a reversal pattern is present.
While the indicator reading is below 50, a shooting star is formed on a price pullback, triggering a short signal.
[Chart 10]
Stochastics
Overbought/Oversold Condition
Stochastics are probably the indicator that produces the best overbought/oversold signals.
Wait for the indicator reading to get back to neutral territory from overbought/oversold territory and a reversal candlestick pattern is formed.
Take a look at this on your charts – you will this is one of the most common and effective combinations. These two technical tools are very powerful when used together
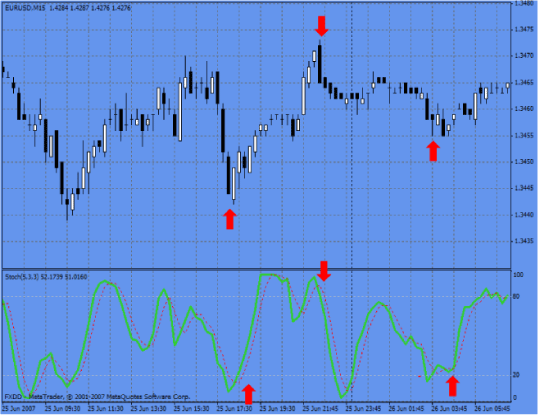
[Chart 11]
Divergence
The signal is triggered when a reversal candlestick pattern is present on the last peak/trough of the divergence pattern.
While the price made a significant lower low, the stochastic made a higher high. The reversal hammer occurred at a point the oscillator was making higher low
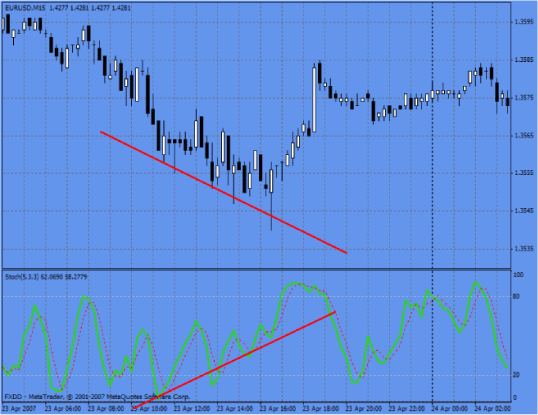
[Chart 12]
Bollinger Bands
Bands as support and resistance
As we have seen, the Bollinger bands indicator is used as a volatility indicator. But sometimes the bands are used as support and resistance levels.
Here we can see several patterns developed below/above the bands. Remember the signals that have the highest probability of success are those that are in direction of the trend as this indicator is prone to whipsawing in ranging conditions.
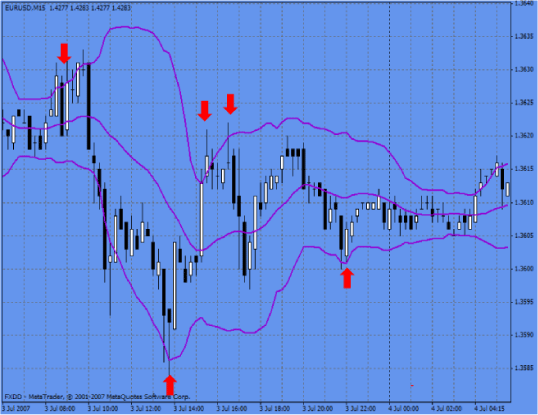
[Chart 13]
Fibonacci Retracements
The same mechanics are used when trading Fibonacci retracements. We do not go short or long blindly when the price reaches a retracement level. We wait to see is the price reacts at those levels and finally look for a reversal candlestick pattern.
Here we see a shooting star and tombstone doji off the 61.8
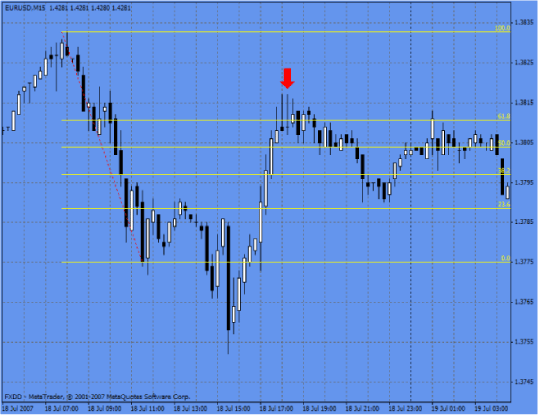
[Chart 14]